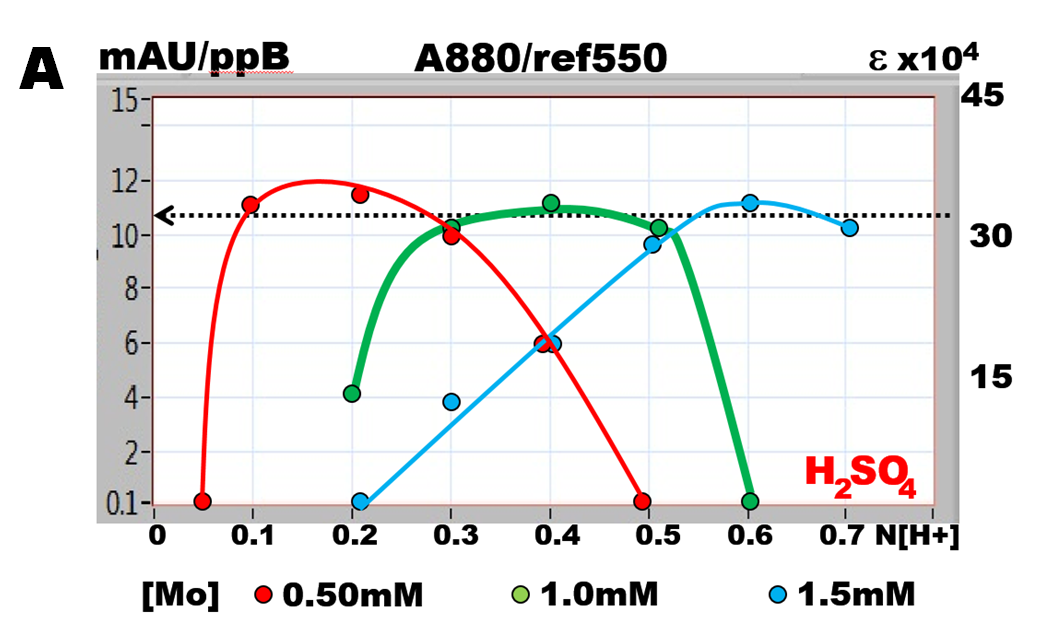
[H]+ Diagram for Sulfuric Acid
The diagram (A) shows dependence of the slope of calibration line (mAU/ppB P) on acidity N[H+] and molarity of molybdate, along with corresponding molar absorptivity
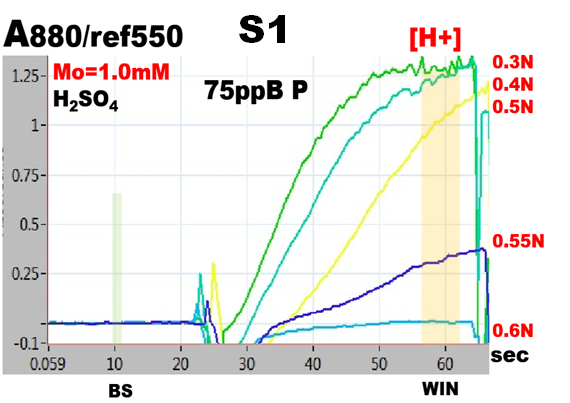
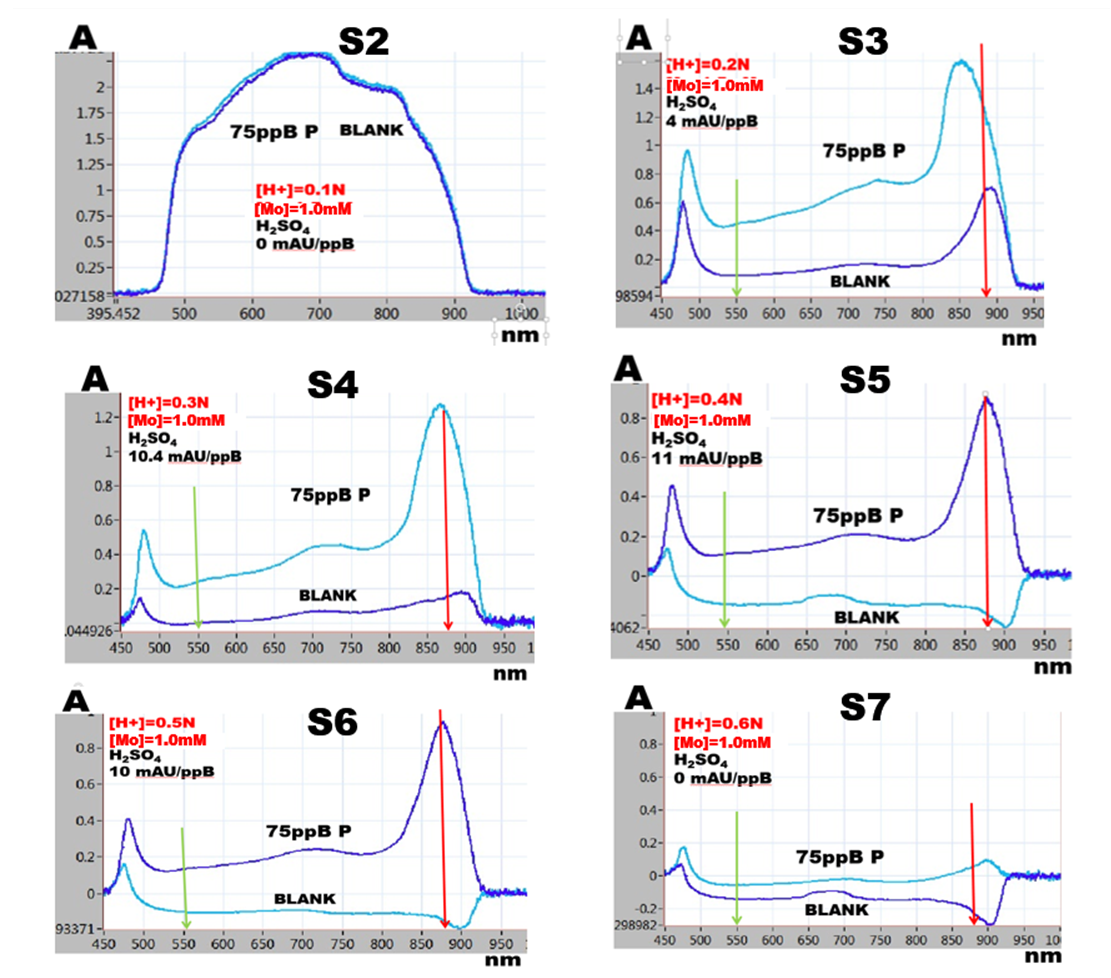
(ε). Figures S1 to S7 show reaction rates and spectra associated with points on the green curve. Reaction rates and spectra for red and blue curves are analogous. For discussion see (1.5.13. and 1.5.14.)